Showing posts with label Jmeter. Show all posts

How to fixed ERROR - jmeter.threads.JMeterThread: Test failed! java.lang.OutOfMemoryError: unable to create new native thread

Following are the error and solution of “ERROR-jmeter-threads-JMeterThread-Test-failed-java-lang-OutOfMemoryError-unable-to-create-new-native-thread-in-Unix”:
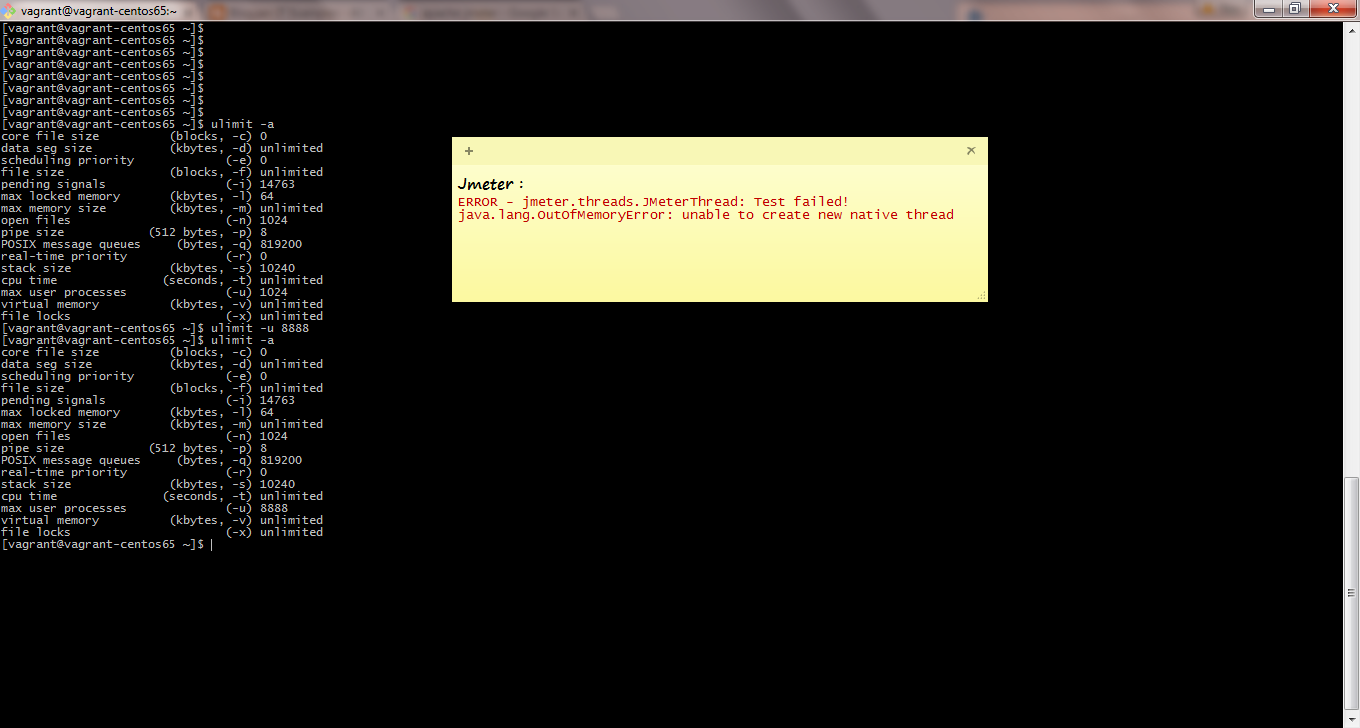
ERROR - jmeter.threads.JMeterThread: Test failed! java.lang.OutOfMemoryError: unable to create new native thread


Error- jmeter.threads.JMeterThread: Test failed! java.lang.OutOfMemoryError: unable to create new native thread
        at java.lang.Thread.start0(Native Method)
        at java.lang.Thread.start(Thread.java:714)
        at sun.net.www.http.KeepAliveCache$1.run(KeepAliveCache.java:112)
        at sun.net.www.http.KeepAliveCache$1.run(KeepAliveCache.java:96)
        at java.security.AccessController.doPrivileged(Native Method)
        at sun.net.www.http.KeepAliveCache.put(KeepAliveCache.java:95)
        at sun.net.www.http.HttpClient.putInKeepAliveCache(HttpClient.java:407)
        at sun.net.www.http.HttpClient.finished(HttpClient.java:364)
        at sun.net.www.http.KeepAliveStream.close(KeepAliveStream.java:100)
        at sun.net.www.MeteredStream.justRead(MeteredStream.java:93)
        at sun.net.www.MeteredStream.read(MeteredStream.java:135)
        at java.io.FilterInputStream.read(FilterInputStream.java:133)
        at sun.net.www.protocol.http.HttpURLConnection$HttpInputStream.read(HttpURLConnection.java:3066)
        at org.apache.commons.io.input.ProxyInputStream.read(ProxyInputStream.java:98)
        at java.util.zip.InflaterInputStream.fill(InflaterInputStream.java:238)
        at java.util.zip.InflaterInputStream.read(InflaterInputStream.java:158)
        at java.util.zip.GZIPInputStream.read(GZIPInputStream.java:116)
        at java.io.BufferedInputStream.fill(BufferedInputStream.java:235)
        at java.io.BufferedInputStream.read1(BufferedInputStream.java:275)
        at java.io.BufferedInputStream.read(BufferedInputStream.java:334)
        at java.io.FilterInputStream.read(FilterInputStream.java:107)
        at org.apache.jmeter.protocol.http.sampler.HTTPSamplerBase.readResponse(HTTPSamplerBase.java:1745)
        at org.apache.jmeter.protocol.http.sampler.HTTPAbstractImpl.readResponse(HTTPAbstractImpl.java:438)
        at org.apache.jmeter.protocol.http.sampler.HTTPJavaImpl.readResponse(HTTPJavaImpl.java:285)
        at org.apache.jmeter.protocol.http.sampler.HTTPJavaImpl.sample(HTTPJavaImpl.java:516)
        at org.apache.jmeter.protocol.http.sampler.HTTPSamplerProxy.sample(HTTPSamplerProxy.java:74)
        at org.apache.jmeter.protocol.http.sampler.HTTPSamplerBase.sample(HTTPSamplerBase.java:1146)
        at org.apache.jmeter.protocol.http.sampler.HTTPSamplerBase.sample(HTTPSamplerBase.java:1135)
        at org.apache.jmeter.threads.JMeterThread.process_sampler(JMeterThread.java:434)
        at org.apache.jmeter.threads.JMeterThread.run(JMeterThread.java:261)
        at java.lang.Thread.run(Thread.java:745)


Solution:

Add the JVM_ARGS configuration in your apache-jmeter-*.*/bin/jmeter.sh file

e.g. JVM_ARGS="-d64 -Xms24m –Xmx1024m -Xss228k -server"

Change the value of –Xms and –Xmx as per you requirement whereas put the min value of -Xss228k or –Xss64k

And

Change the ulimit –u (unix/REHL/CentOS) value to higher then number, what you have set in your jmeter script attribute num_threads value.

$ulimit -a
core file size           (blocks, -c) 0
data seg size           (kbytes, -d) unlimited
scheduling priority             (-e) 0
file size               (blocks, -f) unlimited
pending signals                 (-i) 128376
max locked memory       (kbytes, -l) 32
max memory size         (kbytes, -m) unlimited
open files                      (-n) 1024
pipe size            (512 bytes, -p) 8
POSIX message queues     (bytes, -q) 819200
real-time priority              (-r) 0
stack size              (kbytes, -s) 10240
cpu time               (seconds, -t) unlimited
max user processes              (-u) 1024
virtual memory          (kbytes, -v) unlimited
file locks                      (-x) unlimited

For changing the max user processes need to perform below command:

$ulimit –u 8888

$ ulimit -a
core file size          (blocks, -c) 0
data seg size           (kbytes, -d) unlimited
scheduling priority             (-e) 0
file size               (blocks, -f) unlimited
pending signals                 (-i) 128376
max locked memory       (kbytes, -l) 32
max memory size         (kbytes, -m) unlimited
open files                      (-n) 1024
pipe size            (512 bytes, -p) 8
POSIX message queues     (bytes, -q) 819200
real-time priority              (-r) 0
stack size              (kbytes, -s) 10240
cpu time               (seconds, -t) unlimited
max user processes              (-u) 8888
virtual memory          (kbytes, -v) unlimited
file locks                      (-x) unlimited


That’s all about how to fix the issue. Please like and share it!

Reference: Apache Jmeter

How to do load/performance testing both on static and dynamic resources by Apache JMeter


The Apache JMeter™ application is open source software, a 100% pure Java application designed to load test functional behaviour and measure performance. It was originally designed for testing Web Applications but has since expanded to other test functions. Details

Requirement:
1. Windows PC
2. Apache Jmeter

Let’s discussed in more details:

Start the jmeter from */*/bin/jmeter.bat. Where * indicate the your dir in windows.
A window will appear with title bar Apache jmeter.


Add the Thread Group
Right click on the Test Plan > Add > Threads (User) > Thread Group


Change the value under grid Thread Properties
Number of Threads (users) = as per your network bandwidth support or hardware. e.g. 10 or 100 or 1000. I’m performing for 10 users

Add HTTP Request Defaults
Right click on Thread Group > Add > Config Element > HTTP Request Defaults
Server Name or IP: google.co.uk or google.com
Path: /


Add HTTP Request
Right click on Thread Group > Add > Sampler> HTTP Request
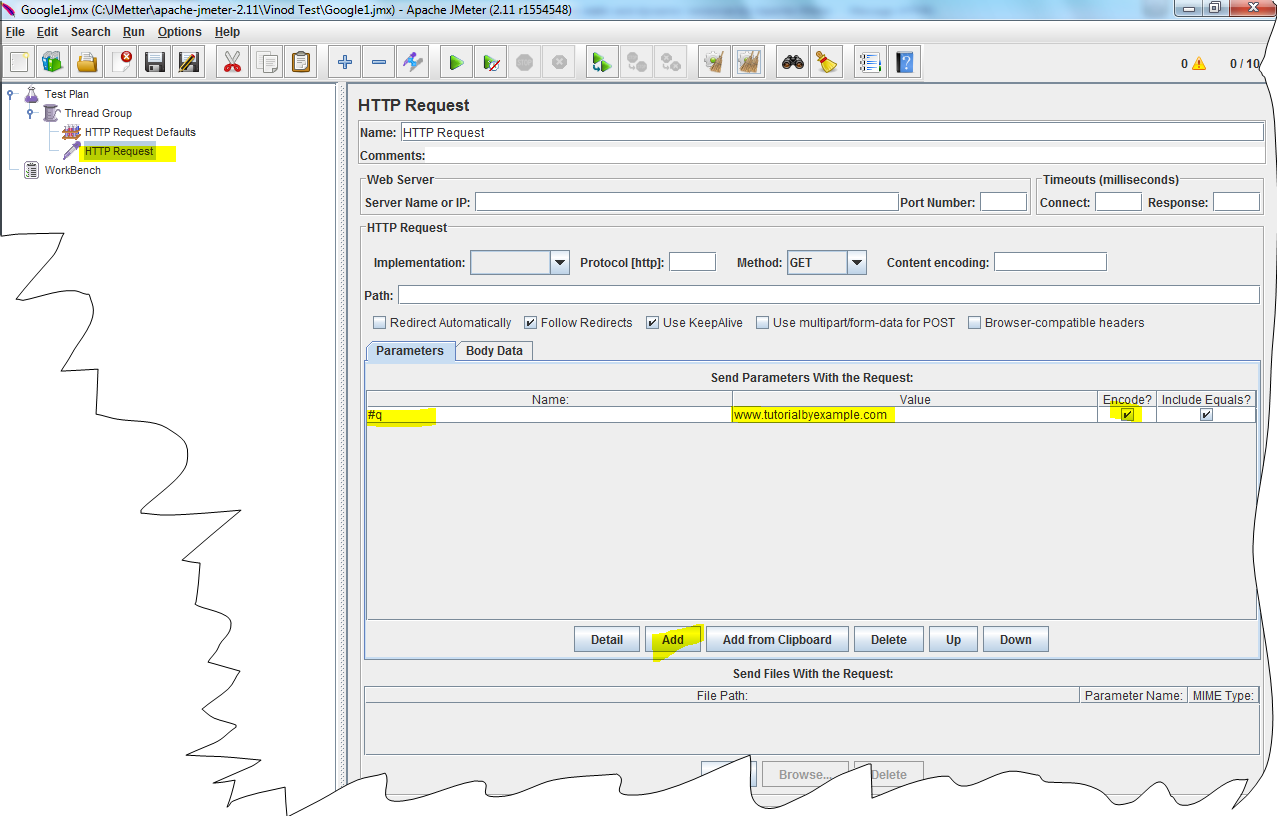
Click on the Add Buton under Parameters tabs, add the value Name: #q and Value www.tutorialbyexample.com and click on the Encoded? Checked.


Add the Listener, Aggregate Graph, Aggregate Report, 


Click on the Test plan and Save it.

Run the Test plan

Click on the Test Plan and from Run menu select Run.


Just change the Thread Group value for Number of Threads (users) as pre your requirement and parameter.

Don’t hesitate for any query related to this, I’ll more than happy to answered if any.

Please like and share it!!!

Reference:
https://jmeter.apache.org/ 

Jmeter Issue 32bit vs 64bit Physical RAM swap Space


Following issue in Jmeter:

# There is insufficient memory for the Java Runtime Environment to continue.
# Native memory allocation (malloc) failed to allocate 32756 bytes for ChunkPool::allocate
# Possible reasons:
# The system is out of physical RAM or swap space
# In 32 bit mode, the process size limit was hit
# Possible solutions:
# Reduce memory load on the system
# Increase physical memory or swap space
# Check if swap backing store is full
# Use 64 bit Java on a 64 bit OS
Solution: 
Change the value as mention below in /apache-jmeter-2.9/bin/jmeter.sh 
JAVA_HOME=/JDK1.7.51-64/jdk1.7.0_51/
PATH=/JDK1.7.51-64/jdk1.7.0_51/bin:$PATH
export PATH
export JAVA_HOME
JVM_ARGS="-d64 -Xms1024m -Xmx50000m -server"
/JDK1.7.51-64/jdk1.7.0_51/bin/java $JVM_ARGS -jar `dirname $0`/ApacheJMeter.jar "$@"

Verify it: Run the /apache-jmeter-2.9/bin/jmeter.sh

jmeter.log will generated with below message:

INFO - jmeter.util.JMeterUtils: Setting Locale to en
INFO - jmeter.JMeter: Loading user properties from: /apache-jmeter-2.9/bin/user.properties
INFO - jmeter.JMeter: Loading system properties from: /apache-jmeter-2.9/bin/system.properties INFO - jmeter.JMeter: Copyright (c) 1998-2013 The Apache Software Foundation
INFO - jmeter.JMeter: Version 2.9 r1437961
INFO - jmeter.JMeter: java.version=1.7.0_51
INFO - jmeter.JMeter: java.vm.name=Java HotSpot(TM) 64-Bit Server VM INFO - jmeter.JMeter: os.name=SunOS
INFO - jmeter.JMeter: os.arch=amd64
INFO - jmeter.JMeter: os.version=5.10
INFO - jmeter.JMeter: file.encoding=ISO646-US
INFO - jmeter.JMeter: Default Locale=English
INFO - jmeter.JMeter: JMeter Locale=English
INFO - jmeter.JMeter: JMeterHome=/apache-jmeter-2.9
INFO - jmeter.JMeter: user.dir =/apache-jmeter-2.9/bin
INFO - jmeter.JMeter: PWD =/apache-jmeter-2.9/bin
INFO - jmeter.JMeter: IP: 10.145.84.100 Name: tutorialbyexample.com FullName: tutorialbyexample.com
INFO - jmeter.JMeter: Loaded icon properties from org/apache/jmeter/images/icon.properties WARN - jmeter.gui.action.ActionRouter: java.awt.HeadlessException: No X11 DISPLAY variable was set, but this program performed an operation which requires it. 2015/04/21 16:03:31 FATAL - jmeter.JMeter: An error occurred: java.awt.HeadlessException: No X11 DISPLAY variable was set, but this program performed an operation which requires it. at java.awt.GraphicsEnvironment.checkHeadless(GraphicsEnvironment.java:207)

Whereas java.vm.name=Java HotSpot(TM) 64-Bit Server VM indicate we have configure it 64 bit and we can increased the max heap size more than 3 GB which is limited for 32 bit jvm.

Have good day ahead!!!

Oracle DataBase Testing By Jmeter


Let's start for JMeter tutorial, how to connect database and all:
Start the jmeter from */*/bin/jmeter.bat. Where * indicate the your dir in windows.
A window will appear with title bar Apache jmeter.


For accessing any database need to configure respective driver (lib ojdbc6.jar).

INFO  - jmeter.engine.StandardJMeterEngine: Running the test!
INFO  - jmeter.samplers.SampleEvent: List of sample_variables: []
WARN  - jmeter.protocol.jdbc.config.DataSourceElement: Could not load driver: oracle.jdbc.OracleDriver java.lang.ClassNotFoundException: oracle.jdbc.OracleDriver
at java.net.URLClassLoader$1.run(URLClassLoader.java:202)
at java.security.AccessController.doPrivileged(Native Method)
at java.net.URLClassLoader.findClass(URLClassLoader.java:190)
at java.lang.ClassLoader.loadClass(ClassLoader.java:306)
at java.lang.ClassLoader.loadClass(ClassLoader.java:247)
at java.lang.Class.forName0(Native Method)
at java.lang.Class.forName(Class.java:247)


Simple need to place the jdbc jar file in jmeter lib dir. After that need to start again jmeter for further development, once you restart copy jar file will load in jmeter container and available for further use.

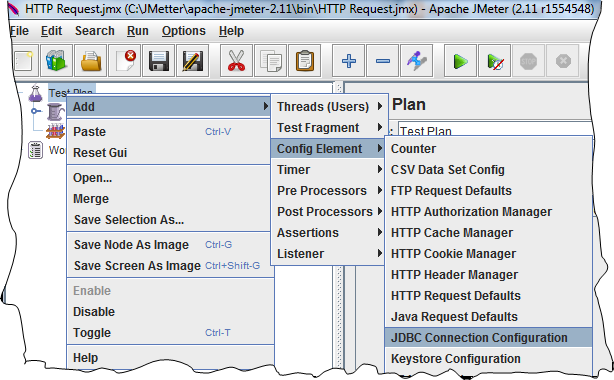
Now, create the JDBC Connection Configuration, for this need to Right Click on Test Plan >
Add > Config Element > JDBC Connection Configuration.

Note: This will be there for project or Thread group level.


Enter the data base details as mention in below image,
Name: JDBCConnectionConfiguration
Variable Name: nameofconnectionordatabase

Connection pool Configuration:

Max Number of Connections: 1 or n as per your db support.

In database connection configuration section:
Database URL: jdbc:oracle:thin:@//IPAddressofdatabase:port/sid
e.g: jdbc:oracle:thin:@//1.1.1.0:1234/nameofsid
JDBC Drive Class: oracle.jdbc.OracleDriver
User name and Password


For more details refer the http://jmeter.apache.org/

Right click on the My Thread Group > Sampler > JDBC Request
Enter the name of connect variable what we have added for JDBC Connection Configuration.
In Variable Name: nameofconnectionordatabase
Select the respective DML for me I selected the select statement.
Whatever query you have in query section.
e.g select * from dual;


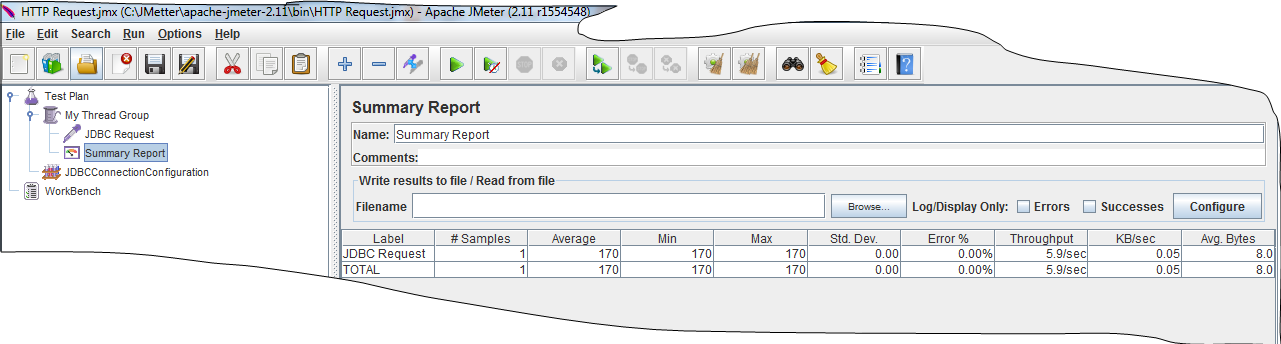
Create the summary report > right click on the My Thread Group > Add > Listener > Summary Report.


Save it with your love name.
Click on the Test Plan and run it from tab button or from Run > Start.
You will able to see some result like above screen.


JDBCOracle.jxm file will same, We can use this file for running from Unxi system:
<?xml version="1.0" encoding="UTF-8"?>
<jmeterTestPlan version="1.2" properties="2.6" jmeter="2.11 r1554548">
  <hashTree>
    <TestPlan guiclass="TestPlanGui" testclass="TestPlan" testname="Test Plan" enabled="true">
      <stringProp name="TestPlan.comments"></stringProp>
      <boolProp name="TestPlan.functional_mode">false</boolProp>
      <boolProp name="TestPlan.serialize_threadgroups">false</boolProp>
      <elementProp name="TestPlan.user_defined_variables" elementType="Arguments" guiclass="ArgumentsPanel" testclass="Arguments" testname="User Defined Variables" enabled="true">
        <collectionProp name="Arguments.arguments"/>
      </elementProp>
      <stringProp name="TestPlan.user_define_classpath"></stringProp>
    </TestPlan>
    <hashTree>
      <ThreadGroup guiclass="ThreadGroupGui" testclass="ThreadGroup" testname="My Thread Group" enabled="true">
        <stringProp name="ThreadGroup.on_sample_error">continue</stringProp>
        <elementProp name="ThreadGroup.main_controller" elementType="LoopController" guiclass="LoopControlPanel" testclass="LoopController" testname="Loop Controller" enabled="true">
          <boolProp name="LoopController.continue_forever">false</boolProp>
          <stringProp name="LoopController.loops">1</stringProp>
        </elementProp>
        <stringProp name="ThreadGroup.num_threads">1</stringProp>
        <stringProp name="ThreadGroup.ramp_time">1</stringProp>
        <longProp name="ThreadGroup.start_time">1421937486000</longProp>
        <longProp name="ThreadGroup.end_time">1421937486000</longProp>
        <boolProp name="ThreadGroup.scheduler">false</boolProp>
        <stringProp name="ThreadGroup.duration"></stringProp>
        <stringProp name="ThreadGroup.delay"></stringProp>
      </ThreadGroup>
      <hashTree>
        <JDBCSampler guiclass="TestBeanGUI" testclass="JDBCSampler" testname="JDBC Request" enabled="true">
          <stringProp name="dataSource">nameofconnectionordatabase</stringProp>
          <stringProp name="query">select * from dual</stringProp>
          <stringProp name="queryArguments"></stringProp>
          <stringProp name="queryArgumentsTypes"></stringProp>
          <stringProp name="queryTimeout"></stringProp>
          <stringProp name="queryType">Select Statement</stringProp>
          <stringProp name="resultVariable"></stringProp>
          <stringProp name="variableNames"></stringProp>
        </JDBCSampler>
        <hashTree/>
        <ResultCollector guiclass="SummaryReport" testclass="ResultCollector" testname="Summary Report" enabled="true">
          <boolProp name="ResultCollector.error_logging">false</boolProp>
          <objProp>
            <name>saveConfig</name>
            <value class="SampleSaveConfiguration">
              <time>true</time>
              <latency>true</latency>
              <timestamp>true</timestamp>
              <success>true</success>
              <label>true</label>
              <code>true</code>
              <message>true</message>
              <threadName>true</threadName>
              <dataType>true</dataType>
              <encoding>false</encoding>
              <assertions>true</assertions>
              <subresults>true</subresults>
              <responseData>false</responseData>
              <samplerData>false</samplerData>
              <xml>false</xml>
              <fieldNames>false</fieldNames>
              <responseHeaders>false</responseHeaders>
              <requestHeaders>false</requestHeaders>
              <responseDataOnError>false</responseDataOnError>
              <saveAssertionResultsFailureMessage>false</saveAssertionResultsFailureMessage>
              <assertionsResultsToSave>0</assertionsResultsToSave>
              <bytes>true</bytes>
            </value>
          </objProp>
          <stringProp name="filename"></stringProp>
        </ResultCollector>
        <hashTree/>
      </hashTree>
      <JDBCDataSource guiclass="TestBeanGUI" testclass="JDBCDataSource" testname="JDBCConnectionConfiguration" enabled="true">
        <boolProp name="autocommit">true</boolProp>
        <stringProp name="checkQuery">Select 1</stringProp>
        <stringProp name="connectionAge">5000</stringProp>
        <stringProp name="dataSource">nameofconnectionordatabase</stringProp>
        <stringProp name="dbUrl">jdbc:oracle:thin:@//IPAddress:Port/SID</stringProp>
        <stringProp name="driver">oracle.jdbc.OracleDriver</stringProp>
        <boolProp name="keepAlive">true</boolProp>
        <stringProp name="password">Password_schema</stringProp>
        <stringProp name="poolMax">1</stringProp>
        <stringProp name="timeout">10000</stringProp>
        <stringProp name="transactionIsolation">DEFAULT</stringProp>
        <stringProp name="trimInterval">60000</stringProp>
        <stringProp name="username">User_Schema</stringProp>
      </JDBCDataSource>
      <hashTree/>
    </hashTree>
  </hashTree>
</jmeterTestPlan>

Learn from any stage any time, don't limit your self time to learn.

Jmeter Initial


In this tutorial, going to discussed about the Jmeter, open source tool for performance testing.

Following are the topic we'll discussed in more details:

Performance Testing & Types of Performance testing
Pre Requisites
Jmeter Features
Jmeter installation
Jmeter Components
  Test Plan and its elements
  Creating a TestPlan
  Thread Group
  Sampler Controllers
  Listeners and Timers
  Logical Controller
  Graphs and Reports

Performance Testing & Types of Performance testing:
Definition: Performance testing, in general, is testing performed to determine how a system performs in terms of responsiveness and stability under a particular User load (concurrent users).
Other attributes Performance testing validates or verifies
   Scalability
   Reliability
   Resource usage
Main Objective:
   Find bottlenecks
   Improve customer experience


Load testing: Evaluate the behavior of the application under increasing load. Identify the highest load the application is designed to perform correctly.
Stress testing:  Evaluate a system or component at or beyond the limits of anticipated or specified workloads, or with reduced availability of resources such as access to memory or servers. This test is an attempt to break the system by suppressing its resources.
Spike Testing: Spike testing is done by suddenly increasing the load generated by users by a very large amount and observing the behavior of the system.
Soak Testing: Soak testing also known as endurance testing, is usually done to determine if the system can sustain the continuous expected load. During soak tests memory utilization is monitored to detect potential leaks.
Volume Testing: Testing whether the system is subject to large volumes of data.

Pre Requisites

Non Functional Requirements Document should be available which gives the details of the types of load test to be performed, number of concurrent users to be loaded, expected response time and other performance attributes to be captured.

Dedicated performance test environment to be available.

Test Environment should be like the actual production environment.

Get the details like the app server, DB server configurations etc.

Performance Test approach document should be ready and is signed off by all the concerned stake holders.

Jmeter Features
It’s free. It’s open source
It is 100% Java application
It has simple and intuitive GUI
It can do load and performance test on several servers:
    Web - HTTP,HTTPS, SOAP
    Database via JDBC, LDAP, JMS
    Mail - POP3

It is platform-independent tool. On Linux/Unix, JMeter can be invoked by clicking on JMeter shell script jmeter.sh. On Windows it can be invoked by starting the jmeter.bat file.
JMeter store its test plans in XML format. This means you can generate a test plan using a text editor.
It is full multi-threading framework allows concurrent sampling by many threads and simultaneous sampling of different functions by separate thread groups.
It is highly extensible.
Controllers are configurable and can monitor server performance.
Test results can be captured in various format like summary report, aggregate report, graph, aggregate graph, results in tree, results in table

Jmeter life cycle

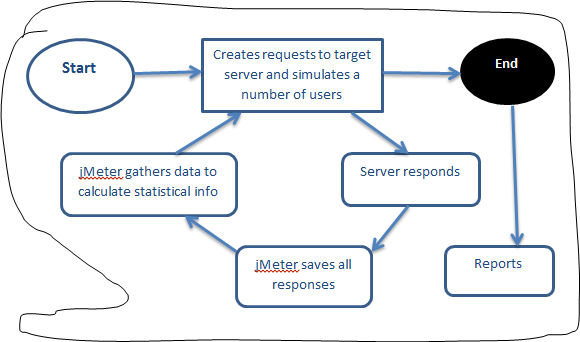
jmeter simulates a group of users sending requests to a target server, and return statistics that show the performance/functionality of the target server/application via tables, graphs etc.


Jmeter tutorial example http://tutorialbyexample.blogspot.com
Jmeter


Jmeter Performance tool and installation
jMeter is an open source, pure Java application, software testing tool for load and performance testing

Installation:
Step 1: Install Java – JDK above version 6
 If already installed, verify the version
 Windows – Open Command Prompt - java -version
 Linux – Open Command Terminal - $java -version
Step 2: Download jMeter: https://jmeter.apache.org/download_jmeter.cgi
Step 3: Unzip the files to the destination folder

Step 4: Double click on jMeter.bat to open the application.
            It will there in \apache-jmeter-2.11\bin\jMeter.bat


Fundamental  jMeter Components
Test Plan: defines a series of steps on how and what to test. Only one test plan can be added per script and can be saved for future use.
Thread Group:  Represents a set of actions added under test plan and can simulate multiple users.

Http request sampler: Records requests to web server and receives response

Elements of a Test Plan
A test plan provides a layout of how and what to test
Some of the test plan elements are:
  Thread Group
  Controllers
  Listeners
  Timers
  Assertions
  Configuration Elements
  Pre-Processor Elements
  Post-Processor Elements


Creating a test plan
Add the following elements to the test plan for a basic test scenario
    Add number of users using Thread Group
    Add  default HTTP request from Config element
    Add HTTP Request from Samplers
    Add Listener to view results

Thread group
The thread group elements control the number of threads JMeter will use during the test.
To create the Thread Group, first run JMeter, from opened interface of JMeter choose Test Plan from the tree and right click to choose Add -> Threads (Users) ->Thread Group.
After opening thread Group, enter Thread Properties as given below
Number of Threads: The required number of Virtual users is specified here.
Loop Count: How many times (iterations) it is required to execute

Ramp-Up Period: How the load to be increased

Right click on the Test Plan > Add > Threads (Users) > Thread Group


Change the name of My Thread Group, we can put as much as we want to put for load for concurrent user, loop count and all.


Right click on the My Thread Group > Add > Sampler > HTTP Request


Enter the Server or IP address


Listeners and Timers
Listeners: Listeners are used to view the results in the form of graph, tree or numbers. Listeners like view results tree shows data for each item with details like request, response and transaction status and Summary report listener will give complete performance information, simulated users and details in numbers for each user.
Timers: Timers allow JMeter to delay between each request which a thread makes. Timer can solve the server overload problem.
  Types of Timers
  Constant Timer
  Constant Throughput Timer
  Uniform Random Timer
  Gaussian Random Timer
  BeanShell Timer
  Poisson Random Timer
  BSF Timer
  JSR223 Timer
  Synchronizing Timer

Logical Controller
Logical Controllers: Logic Controllers let you control order of processing of Samplers in a Thread. Logic Controllers can change the order of request coming from any of their child elements.


Some examples are: For Each Controller, While Controller, Loop Controller, IF Controller, Run Time Controller, Interleave Controller, Throughput Controller, and Run Once Controller.


Results & Listener

Right click on the My Thread Group > Add > Listener > Select any one of listener.


Save it and click My Thread Group >  Start button on menu button or Run > Start.


Best Practices: Do/Don't
Do not use GUI mode: Run Jmeter in non gui mode. Use jmeter –n-t test.jmx test.jtl
Use Remote and Distributed testing for larger load testing
Do not load more than 300 threads (Vusers) per plan
Do not add listeners & graphs to the Jmeter test plan. Write the results to a file in the system
Erase the local path of all the CSV data set config files
Use naming conventions for all the elements
Do not use XPATH extractor
Generate reports after run
Only save the data that is needed

Do not use assertions unless required.

If you like your self, you will like other as well!